When I think about coastal erosion, I think about Pacifica,
CA. After a declaration of a state of emergency in January 2016 after El Niño
related storms, the news in February about yet another chunk of sandy cliff
falling into the ocean and houses in need of abandonment was not new. A drone video of
the area is clear. A lot of information can
be found about how in a few years the cliff has eroded. The Army Corps of Engineers is currently studying coastal erosion fixes for it.
Two online portals have been developed as an
interactive tool for any user to explore what coastal hazards are all about.
Also, the National
Assessment of Coastal Change Hazards of the USGS has very good
information about coastal issues in the country.
Today I am going to focus on another link, the USGS Coastal
Change Portal. The USGS
Coastal Change Hazards Portal is a new tool that allows
anyone to explore how coasts change due to: extreme storms, shoreline change,
and sea level rise.
Extreme
Storms: this allows ‘real-time and scenario-based predictions of
storm-induced coastal change, as well as the supporting data, are provided to
support management of coastal infrastructure, resources, and safety.’ For
example, let’s focus on the Gulf Coast and a scenario of a hurricane (any
category). Let’s see how a Cat 1 and a Cat 5 possibly looks like (with
probabilities of collision (dune erosion), overwash, and inundation for sandy
beaches along the Gulf and Atlantic coasts during a generalized hurricane
landfall): see figures for both. The most probable areas should be risks areas
and treated as such in an emergency.

Shoreline
Change: this shows: ‘historical shoreline positions and rates of
change along ocean shorelines of the United States’. Looking into the East
coast now, offshore Norfolk, see figures for long-term coastal change rates,
and for the short-term rates (<30 years rates of shoreline change for
open-ocean shorelines of the United States ranging from 1970's to 2001).
Sea level Rise: there are two methods used to address this:
a Coastal Vulnerability Index (CVI), and a probabilistic assessment of
shoreline change.
CVI: ‘a preliminary overview, at a National scale, of the
relative susceptibility of the Nation's coast to sea-level rise through the use
of CVI. This classification is based upon the following variables:
geomorphology, regional coastal slope, tide range, wave height, relative
sea-level rise and shoreline erosion and accretion rates. The combination of
these variables and the association of these variables to each other furnish a
broad overview of regions where physical changes are likely to occur due to
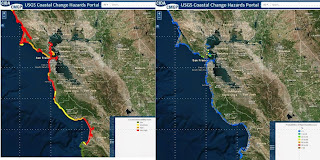
sea-level rise’. A quick image shown here shows how much red (very high
vulnerability) our California coasts possess.
Probabilities
of Shoreline Change: ‘this dataset was used to develop and
evaluate the performance of a Bayesian network (BN) that predicts long-term
shoreline change associated with sea-level rise. The BN is used to define
relationships between driving forces, geologic constraints, and coastal
response, which includes observations of local rates of relative sea-level
rise, wave height, tide range, geomorphology, coastal slope, and rate of
shoreline change. Using this information, the BN is used to make probabilistic
predictions of shoreline change in response to different future sea-level rise
scenarios’. See same area of CA and look at the area of south San Francisco.
 As you can see this new tool will help tremendously to
manage areas and to get a broad idea of what is happening on the US coasts.
As you can see this new tool will help tremendously to
manage areas and to get a broad idea of what is happening on the US coasts.
Explore those links!-


 As you can see this new tool will help tremendously to
manage areas and to get a broad idea of what is happening on the US coasts.
As you can see this new tool will help tremendously to
manage areas and to get a broad idea of what is happening on the US coasts.

 In an area where earthquakes are common, we recently had two events happening: numerous wildfires in the area and a few big storms. In a burned area, a wildfire can make the soils repellent to water, creating a flood like flow on the ground that picks up rock and debris. In an area that has not burned, soil can become saturated. Pressure builds up underground, and soil starts moving and begins picking up mud and debris as it starts flowing downhill, creating mudflows or debris flows.
  There is a USGS page with information on how to identify landslides and what to do if one happens: http://landslides.usgs.gov/learn/prepare.php


