Saturday, October 22, 2022

Week 10: Extreme Weather

 We are discussing extreme weather events this week. This video from National Geographic is a  great introduction to the material showing the interconnectivity of events.

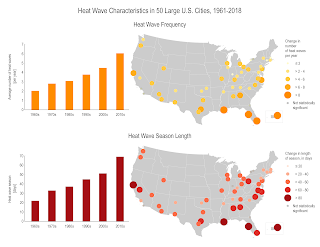
I'll be focusing on Heat waves. They occur more often than they used to in major cities across the United States, from an average of two heat waves per year during the 1960s to more than six per year during the 2010s. ... The average heat wave season across 50 major cities is 47 days longer than it was in the 1960s.
These bar graphs and maps show changes in the number of heat waves per year (frequency) and the number of days between the first and last heat wave of the year (season length). These data were analyzed from 1961 to 2018 for 50 large U.S. metropolitan areas. The graphs show averages across all 50 metropolitan areas by decade. The size/color of each circle in the maps indicates the rate of change per decade. Hatching represents cities where the trend is not statistically significant.


Last summer the mega heat wave left California and other Western states enduring the hottest summer on record. That wave killed more than 1 billion sea creatures in the Pacific Northwest!

These are measures that can help mitigate heat waves as we adapt to heat: (or aqui en Español)

  • Provide community cooling centers, particularly in areas with low-income, elderly, and young populations
  • Ensure proper functioning of energy and water systems
  • Encourage citizens to check on their family, friends, and neighbors to ensure they have access to air conditioning
  • Communicate heat warning information and appropriate responses to the public (e.g., encourage staying indoors, provide symptom reminders)
  • Establish systems such as hotlines to alert public health officials about high-risk or distressed individuals
  • Encourage energy conservation to reduce demand on electricity systems
  • Implement load restrictions for older roads, bridges, and rail to reduce traffic on vulnerable transportation infrastructure

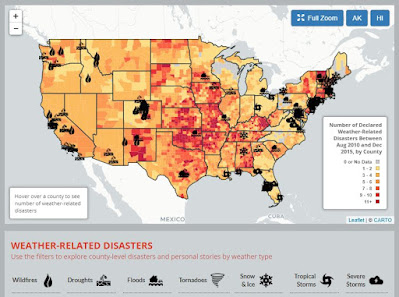
Sites like the Environmental America’s Extreme Weather Map (below) are interactive and help visualize the information of weather-related disasters  2010-2015. Every year, weather-related disasters injure or kill hundreds of Americans and cause billions of dollars in damage. Many of the risks posed by extreme weather will likely increase in a warming world. Scientists have already noted increases in extreme precipitation and heat waves as global warming raises temperatures and exacerbates weather extremes.

Map showing extreme weather events in US 2010-2015

The WunderMap is a really useful site to see the severe weather occurrences updated in the States.

Any of the websites I used here are great places to keep yourselves informed so we can prepare for an extreme weather event.


Stay safe and informed!

Saturday, October 8, 2022

Week 8: Mass Wasting in the US


This week we are discussing 'mass wasting' events...aka, landslides, mudslides, rockslides, etc.

These hazards are connected to others like earthquakes or flooding or wildfires.... although mass wasting events do not need any triggers (just gravity!). As an example, a 7.3 magnitude earthquake hit NE Japan and provoked several landslides and rockslides (image below).

Landslide image by Hironori Asakawa/Kyodo News via AP


Landslides in the United States cause approximately $3.5 billion in damage and kill between 25-50 people annually. The US Landslide inventory map below shows these hazards widespread within the country.

US Landslide Inventory Map


The largest landslide in modern U.S. history (in terms of volume) was most likely one that occurred in 2013 in Bingham Canyon outside of Salt Lake City, Utah. It had a slide mass of 55 million cubic meters (compared to an estimated 10 million cubic meters during the Oso event in 2014).

Landslides impact California’s terrain often. These are generally related to precipitation patterns, in particular if there has been previous months of drought conditions. In January 2019, Pacific storms brought a lot of rainfall to the state. The heavy rain forced residents to evacuate from wildfire-ravaged areas. The “high risk” areas for mudslides are so because they are adjacent to steep slopes or are located at the base of drainage areas. Recent examples are the ‘Woolsey’ and the ‘Hill’ fire burn areas, which will be subject to high volume of mud and debris flow moving forward. 

If you want to know more about these hazards, the USGS page has great information on how to identify landslides and what to do if one happens. If you want to know if you are living in a risk area, you can access maps like the USGS below that shows the Emergency Assessment of Post-Fire Debris-Flow Hazards.


Stay informed and safe-