Wednesday, December 7, 2016

END OF SEMESTER- US NATURAL HAZARDS MAP BY REALTYTRACK- A RECAP

As the last post for this semester I want to share the latest Realytrack map of the US where you can see the riskiest counties in darker color. Maybe the information is surprising for a few of you..Go to the website and check the interactive version  out-

Be prepared and safe out there- Happy Holidays.

http://money.cnn.com/interactive/pf/real-estate/natural-disaster-risk-map/index.html


Sunday, November 20, 2016

11/19/2016- expanding your horizons workshops- go girl science power

GREAT EXPANDING ‘YOUR HORIZONS WORKSHOPS’ ON SATURDAY AT HARTNELL COLLEGE…LOTS OF FUN EXPLORING GEOLOGY WITH GOOGLE CARBOARDS AND TESTING ROCKS.. GO GIRL POWER-
-thank you the Lyceum of Monterey County for organizing this wonderful and empowering event-and thank you to my wonderful friends, Ruby and Sylvia for their support.

Friday, November 11, 2016

11/14/16: COASTAL HAZARDS IN THE US

When I think about coastal erosion, I think about Pacifica, CA. After a declaration of a state of emergency this January after El NiƱo related storms, the news in February about yet another chunk of sandy cliff falling into the ocean and houses in need of abandonment was not new. A drone video of the area is clear. A lot of information can be found about how in a few years the cliff has eroded.

Recently two online portals have been developed as an interactive tool for any user to explore what coastal hazards are all about. Also, the National Assessment of Coastal Change Hazards of the USGS has very good information about coastal issues in the country.

The NOAA’s Sea Level Rise and Coastal Flooding Impacts (v. 2.0) website let you browse over possible scenarios of sea level rise and coast vulnerability. A great link to try!

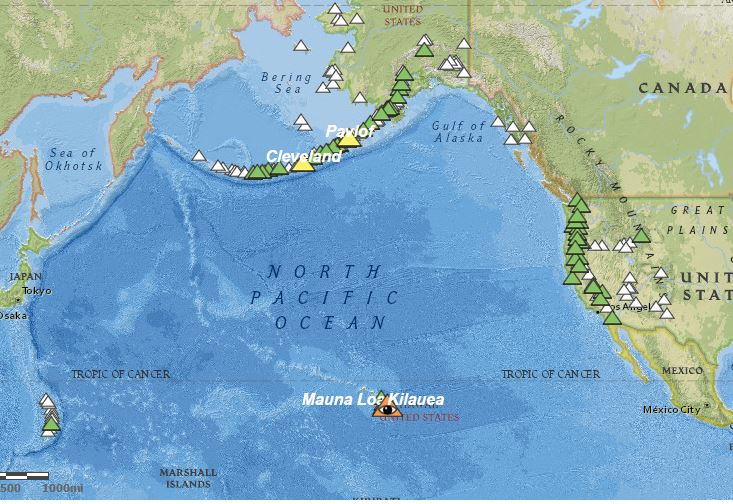
Today I am going to focus on another link, the USGS Coastal Change Portal. The USGS Coastal Change Hazards Portal is a new tool that allows anyone to explore how coasts change due to: extreme storms, shoreline change, and sea level rise.


Extreme Storms: this allows ‘real-time and scenario-based predictions of storm-induced coastal change, as well as the supporting data, are provided to support management of coastal infrastructure, resources, and safety.’ For example, let’s focus on the Gulf Coast and a scenario of a hurricane (any category). Let’s see how a Cat 1 and a Cat 5 possibly looks like (with probabilities of collision (dune erosion), overwash, and inundation for sandy beaches along the Gulf and Atlantic coasts during a generalized hurricane landfall): see figures for both. The most probable areas should be risks areas and treated as such in an emergency.

Shoreline Change: this shows: ‘historical shoreline positions and rates of change along ocean shorelines of the United States’. Looking into the East coast now, offshore Norfolk, see figures for long-term coastal change rates, and for the short-term rates (<30 years rates of shoreline change for open-ocean shorelines of the United States ranging from 1970's to 2001). See image above.

Sea level Rise: there are two methods used to address this: a Coastal Vulnerability Index (CVI), and a probabilistic assessment of shoreline change. 

CVI: ‘a preliminary overview, at a National scale, of the relative susceptibility of the Nation's coast to sea-level rise through the use of CVI. This classification is based upon the following variables: geomorphology, regional coastal slope, tide range, wave height, relative sea-level rise and shoreline erosion and accretion rates. The combination of these variables and the association of these variables to each other furnish a broad overview of regions where physical changes are likely to occur due to sea-level rise’. 

Probabilities of Shoreline Change: ‘this dataset was used to develop and evaluate the performance of a Bayesian network (BN) that predicts long-term shoreline change associated with sea-level rise. The BN is used to define relationships between driving forces, geologic constraints, and coastal response, which includes observations of local rates of relative sea-level rise, wave height, tide range, geomorphology, coastal slope, and rate of shoreline change. Using this information, the BN is used to make probabilistic predictions of shoreline change in response to different future sea-level rise scenarios’. 

As you can see this new tool will help tremendously to manage areas and to get a broad idea of what is happening on the US coasts.

Explore those links!-

Tuesday, November 1, 2016

WELCOME TO THE 2016 CENTRAL COAST GIS DAY- REGISTRATION EXTENDED UNTIL NOV 11TH

A Free Event Hosted By CCJDC and MPC

Come meet other GIS enthusiasts of all levels and engage in your local geospatial community. 


Attendees will learn about GIS technology and its applications. Presenters will showcase their work and take home awesome prizes.


Go to http://www.ccjdc.org/events/gisday2016 


and register! Free extended open registration until November 11th.


-Thank you to our sponsors this year


Sunday, October 23, 2016

10/24/16: Extreme Weather in the U.S.- NEW NOAA REGIONAL IMPACT MAPS

This week we are exploring extreme weather events. In the figure from weatherunderground you can see how in the States, the west, east and south, there are a few happening, like high wind advisory, fire weather advisory, and special statements.

Knowing your weather patterns matters. As the climate changes, so will the weather.
Severe storms resources, like tornado preparedness and supercells can be also found on that website. Very useful information to prepare/educate the population.


NOAA’s National Climatic Data Center provides a variety of information detailing all these extreme weather events. Very recently they have launched the regional climate impacts maps, like the one below for the Pacific Region’

Interesting times…


Tuesday, October 11, 2016

10/11/16: LANDSLIDES IN CALIFORNIA


Landslides impact California’s terrain often. These are generally related to precipitation patterns, in particular if there has been previous months of drought conditions. In 1982, a series of landslides near San Francisco killed 33 people and closed the Golden Gate Bridge. A total of 18,000 different landslides took place in the San Francisco Bay Area following a very heavy rain storm (data collected by aerial surveillance in the days following the event). Two fast-moving fronts carrying extremely heavy rain passed through in a 36-hour period, during which the area received an amount of rain equal to half its average annual precipitation. 

Another famous unstable area is La Conchita. A mudslide of 400,000 tons of mud in 2005 killed 10 people. This should not be surprising as the exact same place suffered another hill collapse in 1995, destroying 9 homes. I that first occasion, the landslide consisted of 600,000 tons of mud and silt slid 600 feet down a cliff face.

The obvious approach is study well the soil in where we put homes and also learn from previous occurrences, understanding that areas that are unstable will continue being so  (La Conchita is not alone; Oso area had been unstable before the 2014 event).  Detailed geologic reports have been made in the past of these places, but the personnel that has the power to act have not followed up/ignored them or have not read them. Gravity always wins. We know better?

After the 2005 disaster, there was an attempt of a $50-million grading project. There were also calls for the county to buy up all the homes through eminent domain and never allow anyone to live there again. It was an idea that came and went, as was the grading project.

There is a USGS page with information on how to identify landslides and what to do if one happens: http://landslides.usgs.gov/learn/prepare.php

More information in links below.


Friday, September 30, 2016

9/30/16- HURRICANE MATTHEW - WATCHING ITS PATH IN THE NEXT FEW DAYS

Still a US THREAT, HURRICANE Matthew is currently a Cat 4, being a dangerous threat to Jamaica, Haiti, Cuba and the Bahamas over the next few days.

The cone or probable path for the next few days is still wide and the European model puts the storm a bit to the west whilst the American model puts it closer to the main land. Either way, we will all be watching..

If you want to know the main differences between the American and the European weather models, go to this link, which explains it simply.
UPDATE-10/6/16
Hurricane's death toll is least 113 people in three Caribbean countries. The overwhelming majority, 108 people, died in Haiti, said Civil Protection Service spokesman Joseph Edgard Celestin.

Up to 2 million people are on Matthew's probable path in the USA and are asked to evacuate. Some Florida residents say they're riding out the storm, defying evacuation orders, which could potentially put in danger emergency responders. 
UPDATE-10/7/16
Hurricane Matthew Lashes FL With 100 MPH Winds, 1 Dead as Nearly 1 Million Lose Power. President Obama this morning urged residents to pay attention to their local officials. While the focus of the storm is on Florida right now, he warned Georgia residents to pay attention, as the storm will likely move north. The new path is shown below. That might mean a semi-direct nit to Charleston on Sat.

Sunday, September 18, 2016

9/19/16: Minimizing Volcanic Hazards: USGS Alert Codes

This week Geol9 is exploring the volcanic hazards in different countries and their warning systems. I’ll be focusing on the US.

There are several ways we minimize the danger of volcanic activity (apart from the obvious of ‘getting out of the way’…(J:

·         Forecasting (earthquakes as early warnings -although in 2014 a Japanese volcano erupted without any previous seismicity (livescience article), land swelling before eruption, gas emissions, etc.)

·         Volcanic Alert Codes (USGS): the levels of alert and the aviation code levels commonly change at the same time (chart on right). A non-erupting volcano will have a green icon, and a red one indicates an imminent eruption (see USGS Alert Codes).

Today the US hazards map shows the following U.S. volcanoes as to be above normal background (elevated unrest or eruptions) or have shown activity that warranted an Information Release (for example, an earthquake swarm):

-Cleveland, Pavlof, Mauna Loa Alert Level=ADVISORY. Aviation Color Code=Yellow.

-Kilauea Alert Level=WATCH. Aviation Color Code=Orange. Note: this one has been erupting for 33 years! (see more here).

More information @

Sunday, September 11, 2016

9/12/16- PREPARING FOR A TSUNAMI- KNOW THE RISK AREAS

This week we talk tsunamis…I recently read in EOS that these natural phenomenon also happened in ancient Mars, having found evidence of 120 m tall waves billions of years ago..

We are obviously more worried about the possible ones here…we actually have a 'Tsunami Preparedness Week', this year held between March 20-26.

A tsunami risk map of the States shows the area along the ring of fire, Hawaii and the West coast, and the US Caribbean islands as the most threatened areas.

In fact, devastating tsunamis have struck North America before and are sure to strike again.. these days the agencies are focusing on faster tsunami warnings, maybe with GPS, or maybe mobile technology, to give people more time to escape to higher ground.


If you are in an area of risk, you should be prepared. The ready.gov website has specifics on what to do.

A lot of useful information can be found online, like the website 'tsunamizone'. If you live in CA, there is an interactive map -below- where the areas of possible risk are colored in pink. Check that website out and see if you are at risk-


Sunday, September 4, 2016

9/5/2016- EARTHQUAKES IN THE USA

If I want to know something about earthquakes, the first websites I go to are: the USGS Real Time Earthquakes Website or the IRIS monitoring website.

This week we are exploring natural seismicity and what countries do to prevent/mitigate this hazard.

Re: the first issue, the new US map of seismicity (see image from USGS) shows the (obvious, in pink) ring of fire portion on the West coast but also a central area in the middle of the plate. I’d like to talk a bit more about this non-obvious one. This area, called the New Madrid Zone was shaken by a M8(!) in 1811. The reason for the activity is a very old intraplate rift placed below the area.


Re: the second issue, I want to focus on the USGS ShakeAlert system, developed for the West coast using some of the existing systems. Today, the technology exists to detect earthquakes, so quickly, that an alert can reach some areas before strong shaking arrives. The purpose of an EEW (Earthquake Early Warning) system is to identify and characterize an earthquake a few seconds after it begins, calculate the likely intensity of ground shaking that will result, and deliver warnings to people and infrastructure in harm’s way. Studies of earthquake early warning methods in California have shown that the warning time would range from a few seconds to a few tens of seconds, depending on the distance to the epicenter of the earthquake. 

 A few seconds of warning might make all the difference (enough to stop transit/elevators and to drop, cover, hold on). All, watch out for thsi year's ShakeOut on October 20th.

NOTE- Of course the news of a 5.6 quake in the middle of the USA –OK- was news this week, as it was also felt in seven surrounding states. After that event, there was a shutdown of gas-linked wells. The issue of possible man-made or induced quakes once more resurfaces…for more information on those the USGS website is useful.

All for now-


Monday, August 29, 2016

8/29/16- NATURAL HAZARDS- BLAME IT ON TECTONICS

This week we are exploring plate tectonics and how the location of each country respect to the plate boundaries relates directly with their natural hazards -like volcanoes or earthquakes-

In the past days the center of Italy has suffered devastating shakes -news here-. The devastation comes from the poor construction standards on the houses close to the epicenter, not because it was an inactive area..
nobody that knows where the plates are located was surprised by the event.

In the US, the NOAA map shows clearly how the Easter US is a passive margin and the Western side of the country is a very active one, with the Pacific Plate, Cocos, Juan de Fuca plates connecting to the North American plate. Not a surprise we are on the ‘Ring of Fire’, where a lot of the volcanic and seismic activity happens!

Of course, there are a few exceptions, like the activity of Hawaii (hot spot) or the New Madrid area (ancient rift), both not at plate boundaries, but that will be another post another time.

We might not know when events like volcanic eruptions or big earthquakes will happen, but if you know your Tectonics, you definitely know where the do!

All for now-


Other Plate Maps found at USGS or Esri: interactive


Thursday, August 4, 2016

8/4/2016- VISUALIZING GLOBAL NATURAL DISASTERS

Now that the hurricane season is here, is a good idea to check the national hurricane center in case you are planning any travelling in certain parts of the world. We also have numerous news of flash floods and flooding events all around the planet and if you are paying attention, these are very frequent.
To help prepare and/or visualize worldwide natural catastrophes, there are currently several websites you can use, most of them based on Google maps, some still beta, and most of them including tectonic plates-which makes perfect sense to geologists-. I have included a few here.
-The National Association of Radio Distress-Signalling and Infocommunications (RSOE) operates Emergency and Disaster Information Service (EDIS) within the frame of his own web site which has the objective to monitor and document all the events on Earth which may cause disaster or emergency.

-The NOAA viewer website is also useful to point out how active the Ring of Fire is. Also, their billion-dollar weather and climate disaster map is very telling as well –see image on the left-.

-Another resource that is very useful is the information from insurance companies. An example of the losses of 2015 is below, from artemis.

As you can see, catastrophes are everywhere and that is why we will be exploring all these in the Fall during our Geol9 course at MPC.

Should be fun.

Buckle up-


Monday, May 30, 2016

Open Registration for Central Coast GIS Day 2016: November 16th

      Discovering the World through GIS

GIS Day provides an international forum for users of geographic information systems (GIS) technology to demonstrate real-world applications that are making a difference in our society…join us this November 16th!!

Free Conference in the Central Coast: Details here: http://www.ccjdc.org/events/gisday2016

Sponsored by:


Friday, May 20, 2016

FREE SCREENING in CARMEL TODAY: RACING EXTINCTION

CARMEL UNIFIED SCHOOL DISTRICT TOGETHER WITHNOAA&rsquo;S OFFICE OF NATIONAL MARINE SANCTUARIESINVITE YOU TO A FREE SCREENING
From the Academy Awards Winning Filmmakers of The Cove: 
WHAT:  Students and community members are invited to a FREE film screening of the groundbreaking documentary Racing Extinction.  The screening will be followed by a panel discussion with special guests Joe Morris - Founder/Owner Morris Grassfed Beef; George Matsumoto - Senior Education and Research Specialist, Monterey Bay Aquarium Research Institute; and William Douros - Regional Director, West Coast Region, Office of National Marine Sanctuaries. 
WHO: NOAA&#39;s Office of National Marine Sanctuaries and Carmel Unified School District
WHEN: Friday, May 20, 7- 9 pm.  Doors open at 6:30.
WHERE: Carmel High School Performing Arts Center, Highway 1 and Ocean Ave, Carmel.For more information, contact Seaberry Nachbar- 240-472-9892