Saturday, March 31, 2018

Week 10-Xtreme Weather in the US


The difference between weather and climate is a measure of time. Weather is what conditions of the atmosphere are over a short period of time, and climate is how the atmosphere "behaves" over relatively long periods of time [NASA]. We'll be discussing extreme weather events this week [not cyclones].

The US Weather Service Current Weather Warnings can be seen in the AccuWeather website or the Weather Channel website. 
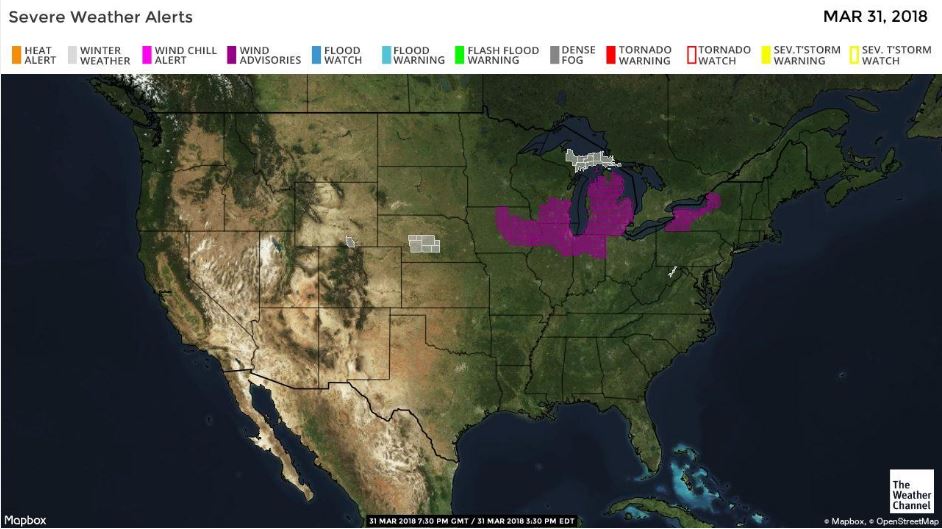
The map shows currently winter weather and wind advisories for the central northern part of the US. Being informed with extreme weather events is the best strategy to be safe and prepare accordingly.


A new interactive map is tracking major weather related events in the States [map below]. It is obvious a few areas get hit again and again…

These days most institutions have a twitter feed you can follow so you are alerted the moment a watch or warning is in effect.

Saturday, March 10, 2018

Week 8- Mudslides Hazards in US- Focus on CA


The largest landslide in modern U.S. history (in terms of volume) was most likely one that occurred in 2013 Bingham Canyon outside of Salt Lake City, Utah. It had a slide mass of 55 million cubic meters (compared to an estimated 10 million cubic meters during the Oso, Washington event). Fortunately, no one was injured or killed during the Utah slide. 


Landslides impact California’s terrain often. These are generally related to precipitation patterns, in particular if there has been previous months of drought conditions. Early this year, across Southern California, heavy rain was causing numerous mudslides and road closures in burn scar areas from recent wildfires. The image on the right clearly shows what type of enormous devastation we are talking about [the total death toll was 20]. That area was previously burned by the Thomas fire, the biggest wildfire in CA’s recorded history, so it is not surprise that heavy rain provoked this mudslides, as the soil had no holding vegetation left.

This is the USGS page with information on how to identify any types of mass wasting events [landslides, mudslides] and what to do if one happens. If you want to know if you are living in a risk area, you can access maps like the USGS below, that shows the Emergency Assessment of Post-Fire Debris-Flow Hazards.

Stay informed and safe-


Saturday, February 17, 2018

Week 5- How to minimize Volcanic Hazards in the US: USGS Alert Codes

This week Geol9 is exploring the volcanic hazards in different countries and their warning systems. I’ll be focusing on the US.
There are several ways we minimize the danger of volcanic activity (apart from the obvious of ‘getting out of the way’…(J:

  • Forecasting (earthquakes as early warnings -although in 2014 a Japanese volcano erupted without any previous seismicity (livescience article), land swelling before eruption, gas emissions, etc.)
  • Volcanic Alert Codes (USGS): the levels of alert and the aviation code levels commonly change at the same time (chart on right). A non-erupting volcano will have a green icon, and a red one indicates an imminent eruption (see USGS Alert Codes).

Today the US hazards map shows 3 U.S. volcanoes as to be above normal background (elevated unrest or eruptions) or have shown activity that warranted an Information Release (for example, an earthquake swarm):


Cleveland and Mauna Loa Alert Level=ADVISORY. Aviation Color Code=Yellow.

Kilauea Alert Level=WATCH. Aviation Color Code=Orange. Note: this one has been erupting for 34 years! (see more here)


More information @

Monday, February 5, 2018

Week 3-S18-Earthquakes-Where and What to Do

This week we are exploring earthquakes and what countries do to prevent/mitigate the hazard. If I want to know something about earthquakes in a place, the first websites I go to are: the USGS Real Time Earthquakes Website or the IRIS monitoring website.

Re: where quakes are located in the US, the 2014 US map of seismicity (see image below from USGS) shows the (obvious, in pink) ring of fire portion on the West coast but also a central area in the middle of the plate. I’d like to talk a bit more about this non-obvious one. This area, called the New MadridZone was shaken by a M8(!) in 1811. The reason for the activity is a very old intraplate rift placed below the area (see image from http://showme.net).

The San Andreas Fault System is responsible for most of California natural quakes...we had over 550 in the last month...up north, the Cascadia Subduction Zone will be responsible for next big one that area has. So, at least we start to knwo the 'why' of these quakes.

Re: the 'what to do about it', apart from the obvious need for education, I want to focus on the USGS ShakeAlert system, developed for the West coast using some of the existing systems. Today, the technology exists to detect earthquakes, so quickly, that an alert can reach some areas before strong shaking arrives. The purpose of an EEW (Earthquake Early Warning) system is to identify and characterize an earthquake a few seconds after it begins, calculate the likely intensity of ground shaking that will result, and deliver warnings to people and infrastructure in harm’s way. Studies of earthquake early warning methods in California have shown that the warning time would range from a few seconds to a few tens of seconds, depending on the distance to the epicenter of the earthquake. 

A few seconds of warning could make all the difference (enough to stop transit/elevators and to drop, cover, hold on).


All for now-


Sunday, January 28, 2018

Week 2-S18- Tectonics explains most things and special moon on the 31 Jan.

This week 2 we are again exploring plate tectonics and how knowing the location of a and how close or not is respect to plate boundaries relates directly with their natural hazards, like volcanoes or earthquakes.


In the US, the NOAA map below shows clearly how the Easter US is a passive margin and the Western side of the country is a very active one, with the Pacific Plate, Cocos, Juan de Fuca plates connecting to the North American plate. Not a surprise we are on the ‘Ring of Fire’, where a lot of the volcanic and seismic activity happens!

Of course, there are a few exceptions, like the activity of Hawaii (hot spot) or the New Madrid area (ancient rift), both not at plate boundaries, but that will be another post another time...

We might not know when events like volcanic eruptions or big earthquakes will happen [note that a lot of these happen underwater...], but if you know your Tectonics, you definitely know where the do!


On a side note, During the early hours of Jan. 31, there will be a full moon, a total lunar eclipse, a blue moon, and a supermoon,,...I am hoping everyone in the west coast has the chance to experience this..more information here.

Monday, October 23, 2017

XTREME WEATHER IN THE STATES

This week we are exploring extreme weather events. In the figure from climate.gov you can see the location that mostly impacted the country last year. All those were billion-dollar disasters. So far, in 2017 (as of October 6th, as per this website), there have been 15 weather and climate disaster events with losses exceeding $1 billion each across the United States [wildfires, droughts, hurricanes..].

Knowing your weather patterns matters. As the climate changes, so will the weather. Global patterns like more droughts, more heavy downpours, heat waves, etc. can be linked to extreme weather events. NOAA staff says: “The point here is that these events are causing up to billions of dollars of damage. As we see the increasing trends in these metrological and hydrological extremes, as a society we really need to think about how we are going to manage the risk, how we’re going to adapt to these changes in extremes.”


NOAA’s National Climatic Data Center provides a variety of information detailing all these extreme weather events. Their yearly maps of U.S. Billion-dollar weather and climate disasters are very informative and should open our eyes about what is happening around us. Interesting times…